Stop Clicking
Start typing.
A tutorial by Matt Frost,
Charlottesville, Virginia
What Do We Mean by "Analysis?"
Usually we're referring to the conversion of recorded data (information) into knowledge through transformation and presentation.
Transformation
- Corrections
- Summaries
- Estimates
- Simulations
Presentation
- Tables
- Figures
- Stories
Tools
- Excel (pivot tables, "what-if" scenarios, etc.)
- MS Access (GROUP BY queries, reports, etc.)
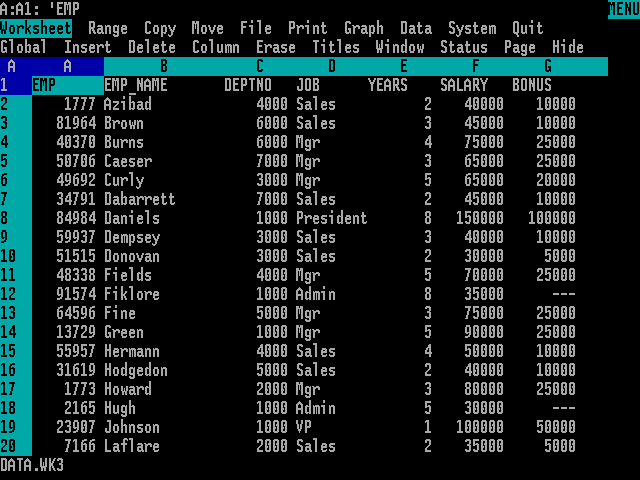
Typical "Clicking" Workflow
- Extract data
- Correct mistakes by editing table cells
- Click on a sequence of menu items and command buttons
- Use "Save as..." to preserve the output
Now, do it again
...but with slightly different source data.
...or with slightly different assumptions to the model.
...or with a different variable of interest.
Get the idea?
Excel Errors, Ripped
from the Headlines
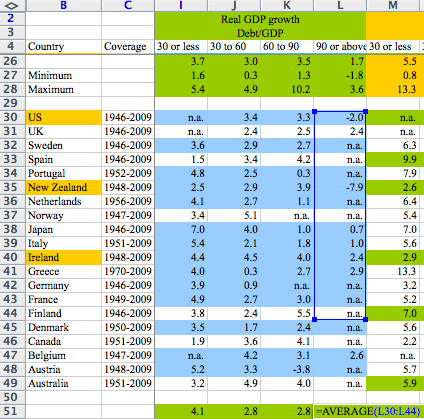
Via nextnewdeal.net
If only...
If only...
...there were some way to tell computers to repeat a set of tasks.
Some way to execute a "program" of instructions...
Some sort of "language" in which those instructions might be given...
STOP!
"I'm not a programmer!"
You aren't an accountant, either, but you seem to use a lot of spreadsheets.
Advantages of Scripted Analysis
- Others can reproduce the process
- It's more transparent
- You can re-use your own components
Enter R
"R is an integrated suite of software facilities for data manipulation, calculation and graphical display."
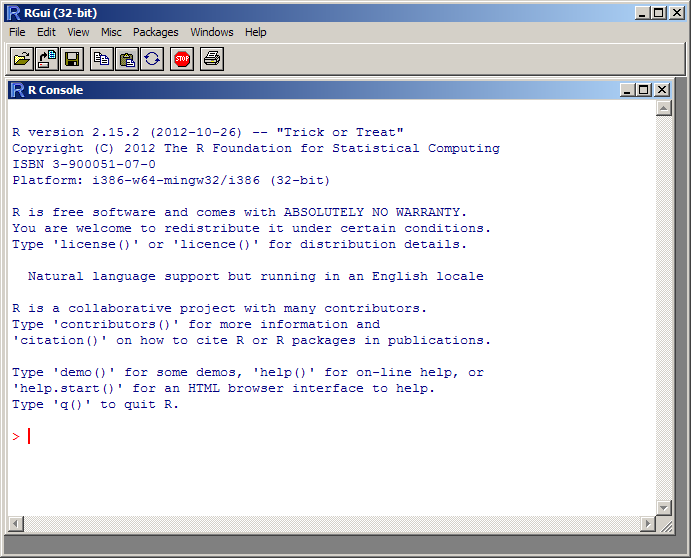
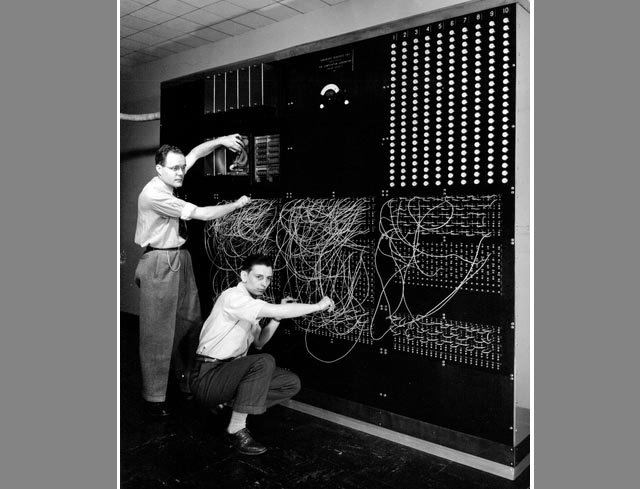
The finest command-line interface 1992 has to offer.
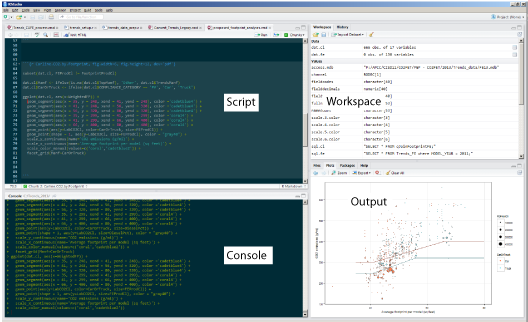
RStudio
RStudio improves the R experience by combining the script editor, data browser, console, and other features into an Integrated Development Environment (IDE)
One Final Concept:
the "Analyst's Notebook"
Integrated source code and output
# Using R for Analysis

## Get R Ready for Analysis

- `require()` loads an external package to offer tools not included in R's core functionality.
- `ggplot2` is a package for graphing data that will exceed your wildest imagination
- `lubridate` provides tools for making working with dates slightly less hateful
- `plyr` allows extremely sophisticated grouping and summarizing

```{r loadpackages}
#  install.packages(c('ggplot2','lubridate','plyr'))
require(ggplot2)
require(lubridate)
require(plyr)
```
The Tutorial

Launch the RStudio Application
Then open tutorial.Rmd
Setup
Set the working directory
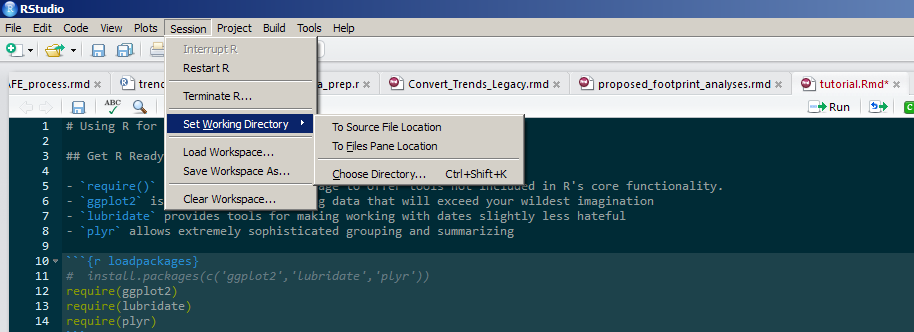
The script needs to know where you have stored the source code and data tables. On my setup, it's in a folder called C:\r_tutorial, but yours might differ.
Go
Wrapping Up
BIG thanks to Hadley Wickham for the "typing vs clicking" hook, and for the world's greatest R packages.
- Questions?
- Suggestions?
- Observations?
mwfrost@gmail.com